A Fine Sommelier Explanation of Bollinger Bands With Kevin Kennis
In order to make the most out of our experience as participants in the DeFi market, Pairings by Sommelier has taken yet another step into facilitating the user experience for Liquidity Providers with the addition of one of the most popular tools for market reading: Bollinger Bands.
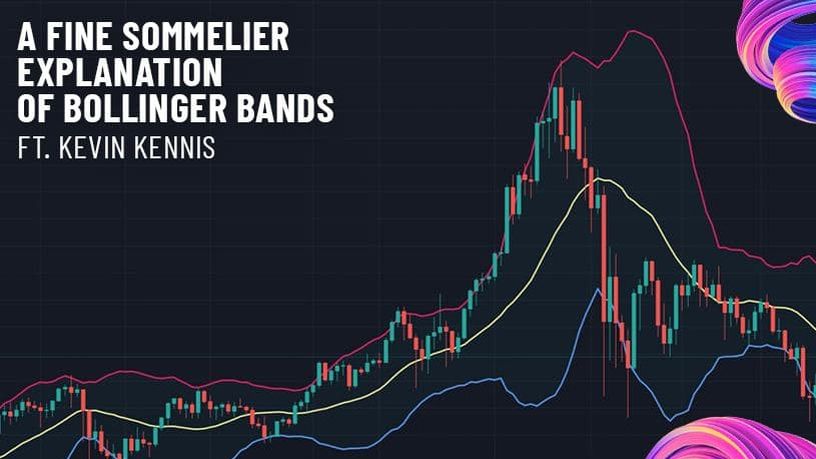
What are Bollinger Bands?
This is a signaling tool that helps us read the variations of the prices of a token or digital assets over time, allowing us to measure its trends and volatility. These signals are presented as bands and are shown in contrast by having one depicted above (upper band) and one below (lower band), letting the trader read the pattern of the market, determining if it’s movements are either large or small.
Bollinger Bands with Kevin Kennis
How are Bollinger Bands being included in Sommelier’s service?
Sommelier uses an algorithm based on Bollinger Bands to suggest optimal liquidity ranges for an LP in a Uniswap V3 pool. Due to the formula behind Bollinger Bands, they adapt to a coin's volatility and regular price movements. So, more volatile coins will have a wider range, and more stable coins will have a more narrow range. This means that Bollinger Bands can form the basis for a safe liquidity range on a wide variety of pools. You can see our Suggested Liquidity Ranges in Sommelier's Pairings App.
How can Bollinger Bands improve the user experience for Liquidity Providers?
Bollinger Bands give the liquidity provider an easy-to-understand method for where to place the lower and upper bound for their liquidity. Choosing the best ranges on one's own can be a complex, time-consuming, and risky process. Liquidity Providers can also adjust the suggested ranges based on their own market opinions by choosing a Market Sentiment (bullish/bearish/neutral), or editing the ranges themselves.
A Quick glossary for Bollinger Bands
What is a Standard Deviation?
Both upper and lower bands are defined as what we call Standard Deviations, which simply means that these are lines that show price variations away or nearer from the expected norm or moving average. This way, we get to see the movements of the market in either direction.
What is a Moving Average?
A moving average is an indicator of price movement that filters short-term variations in a certain market and identifies its trends. This works by the calculation of a data set of a series of average prices, showing if the value of a certain market is rising or devaluing.
What is Volatility?
Volatility is the measure of inconsistencies or big changes in the price of a certain market over a sustained period of time.
What is an Underlying Price?
An underlying price is the current market value of a certain asset.
More articles

Is Speculation Killing Crypto’s Future?

Sommelier's Path Forward: Embracing Revenue Over Narrative
Sommelier January Update
Sommelier Upgrades Cellar Architecture to Enable the Most Powerful DeFi Strategies in the Market
Real Yield USD is Coming to Maximize Stablecoin Yield
Retrospective on 2022 and the Journey Ahead
FAQ - Patache Digital’s Steady Strategies
Patache Digital: Risk Management Discussion
Strategy Deep Dive: Patache Digital
Strategy Provider Spotlight: Patache Digital
User Guide: How to Participate in Strategies on Sommelier

Sommelier Ambassador Program
Strategy Tokens: What Are They and How Do They Work?
6 Core Principles of Sommelier
10/10/22 - Deep Dive on Cleargate Backtesting
Strategy Provider Spotlight: Seven Seas
Deep Dive on Trend and Momentum Strategies
Strategy Provider Spotlight: ClearGate
Supporting Strategy Providers on Sommelier
Sommelier Protocol Team Weekly Update #11

ELI-5 Explanation of the Data Science behind Sommelier’s First Aave Cellar
Sommelier Protocol Team Weekly Update #10
The Data Science Behind Sommelier’s First Aave Cellar
Sommelier Protocol Design Documents
Sommelier Protocol Team Weekly Update #9
Sommelier Protocol Team Weekly Update #8
Sommelier Protocol Team Weekly Update #7

Twitter Spaces With Sommelier: How to Launch a Cellar on Sommelier
Twitter Spaces With Sommelier: Protocol Upgrade and Community Update
Sommelier Protocol Team Weekly Update #4
Sommelier Protocol Team Weekly Update #6
Twitter Spaces With Sommelier: SOMM Airdrop Proposal Data Analysis
Twitter Spaces With Sommelier: Community Update on the First Cellars to Launch
Twitter Spaces With Sommelier: Exploring NFT Cellars
Sommelier Protocol Team Weekly Update #1
Sommelier Protocol Team Weekly Update #2
Sommelier Protocol Team Weekly Update #3

Three Things You Need to Know About Sommelier Governance This Week
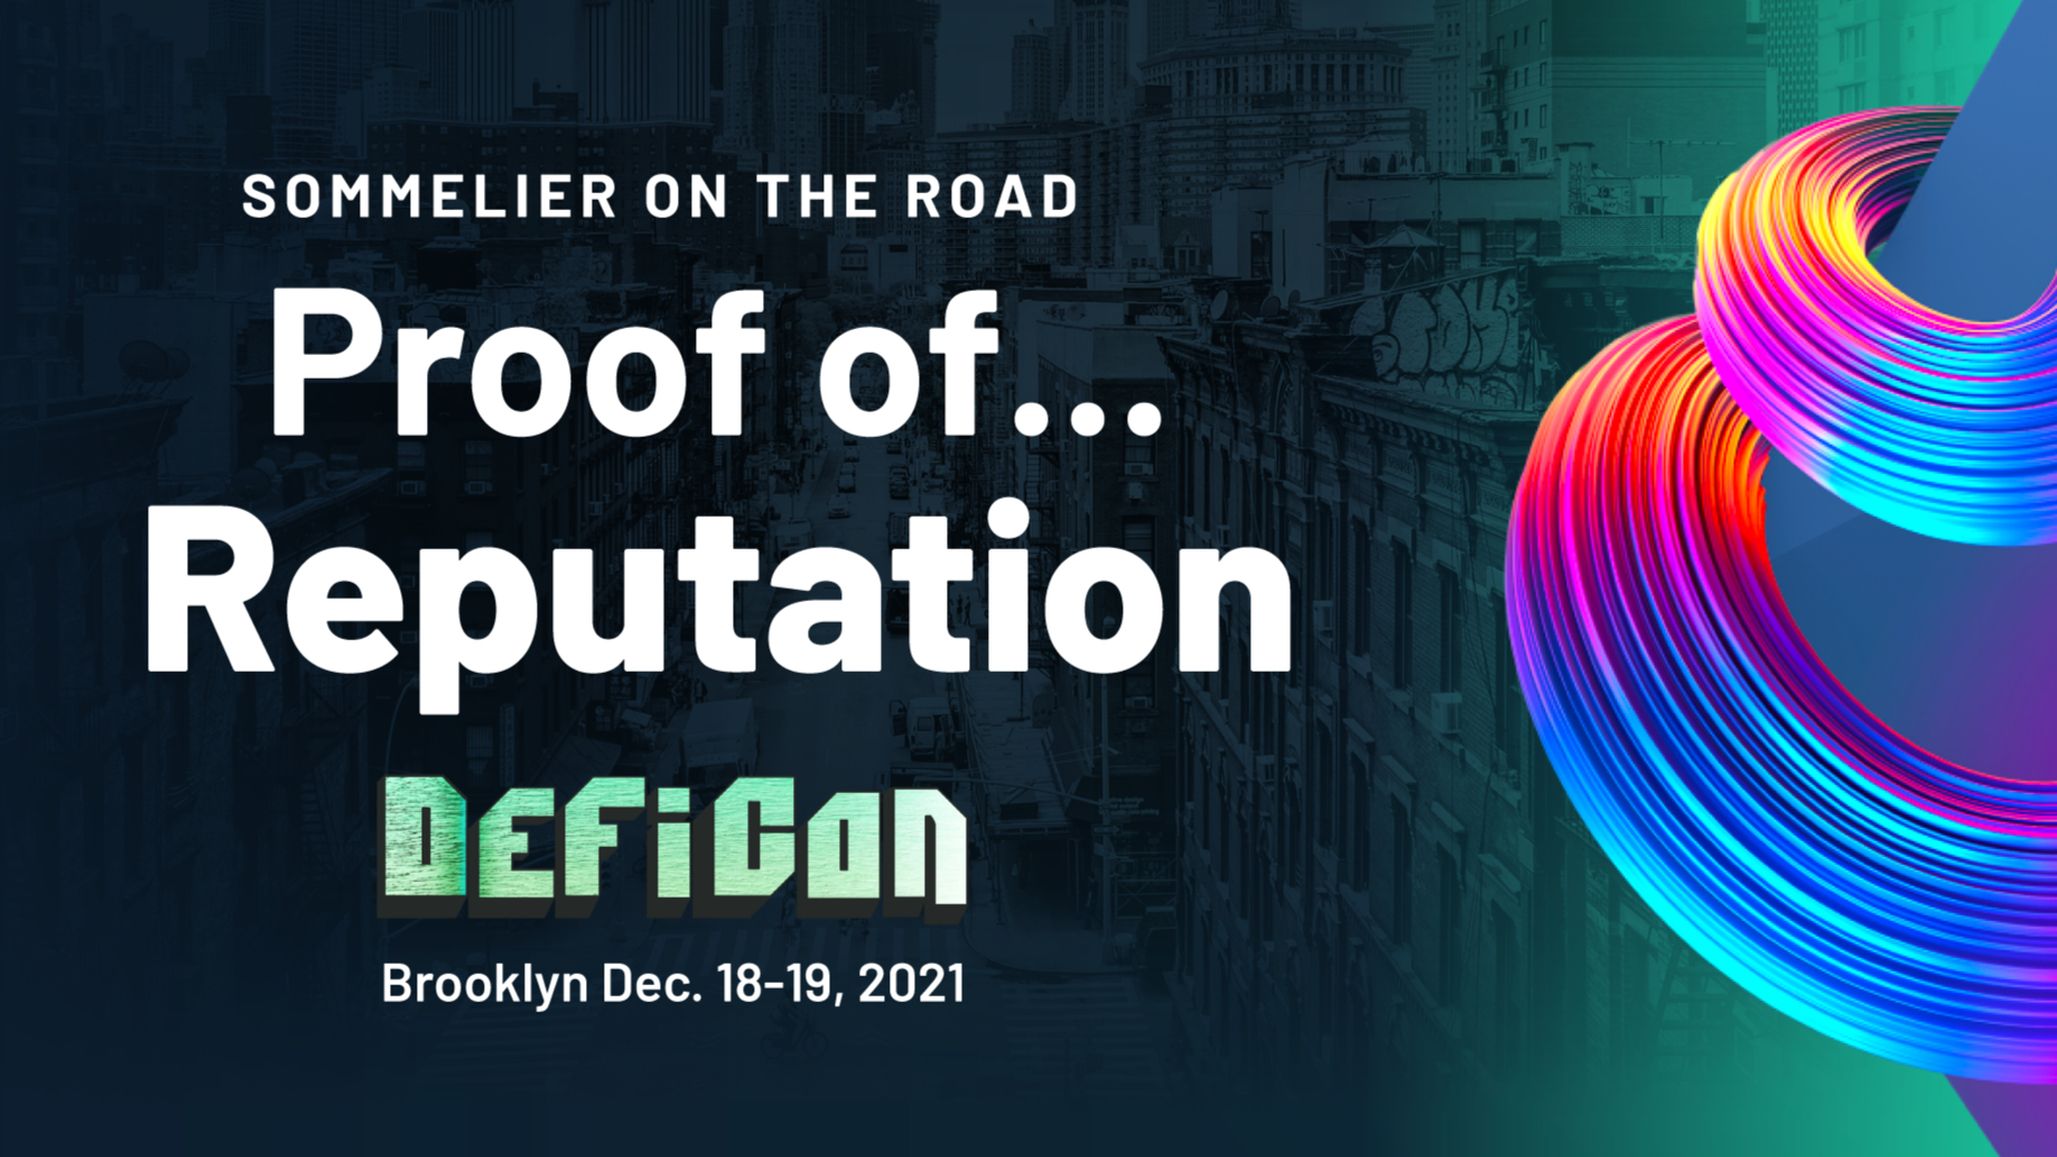
Sommelier On the Road: PROOF OF…REPUTATION
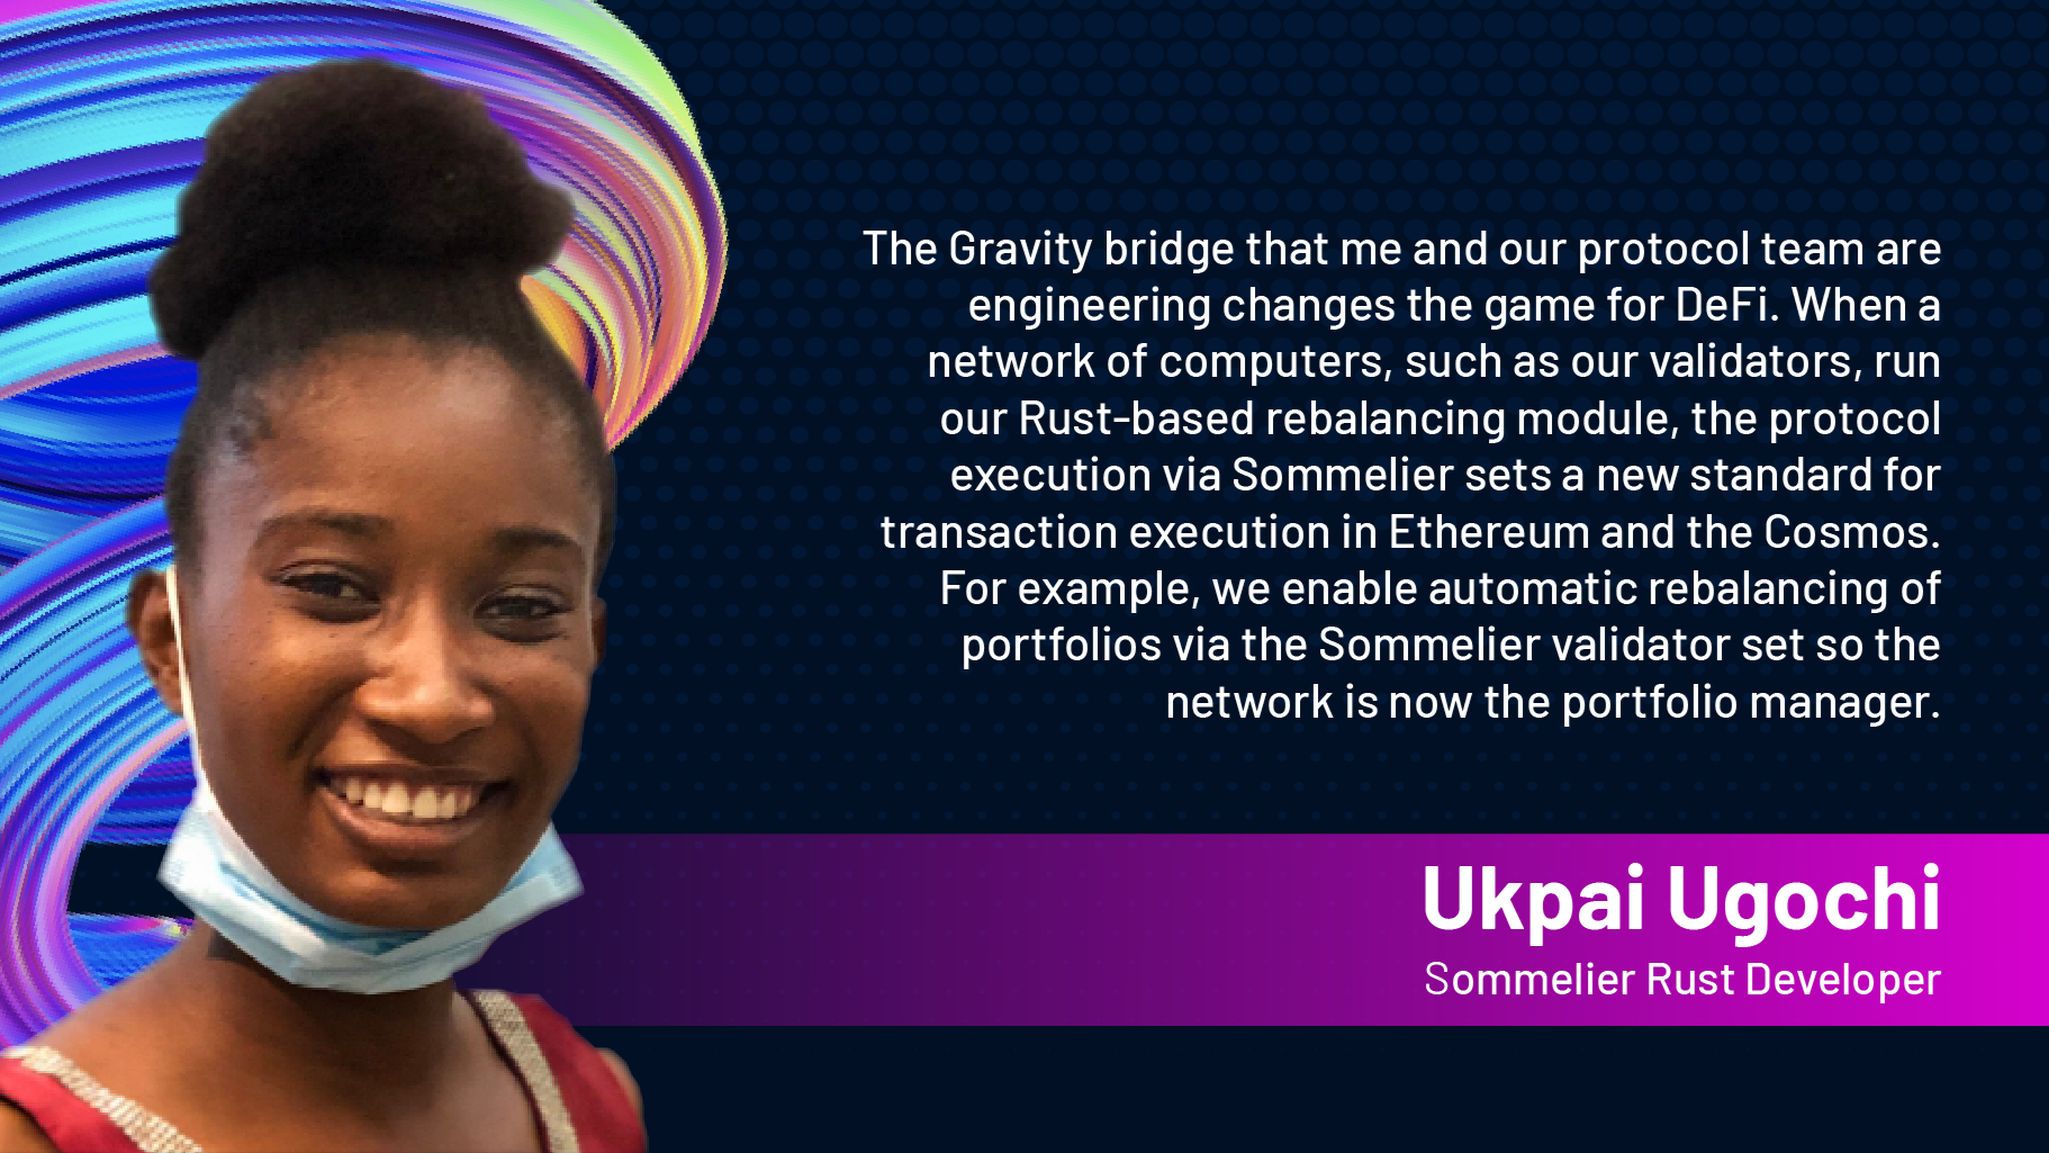
Introducing Ukpai Ugochi - Working on The Sommelier Cellars Rebalancer
Sommelier Announces 23MM Series A Mainnet Round to launch Automated DeFi via the Cosmos
Twitter Spaces With Sommelier: Mainnet Launch & Gravity Bridge
Twitter Spaces With Sommelier: Introducing SOMM Tokenomics
Twitter Spaces With Sommelier: Mysten Labs AMA With Evan Cheng
Introducing SIPS and Sommelier’s Governance Structure
Twitter Spaces With Sommelier: End of Year AMA 2021
Twitter Spaces With Sommelier: Intro to SIPS & Lisbon Blockchain Week
Twitter Spaces With the Sommeliers: Mainnet Update and Governance Launch
Sommelier Partners With Mysten Labs to Make Sommelier and All Cosmos Blockchains the Fastest Protocols on the Planet
Twitter Spaces With the Sommeliers: Sushi AMA With Joseph Delong
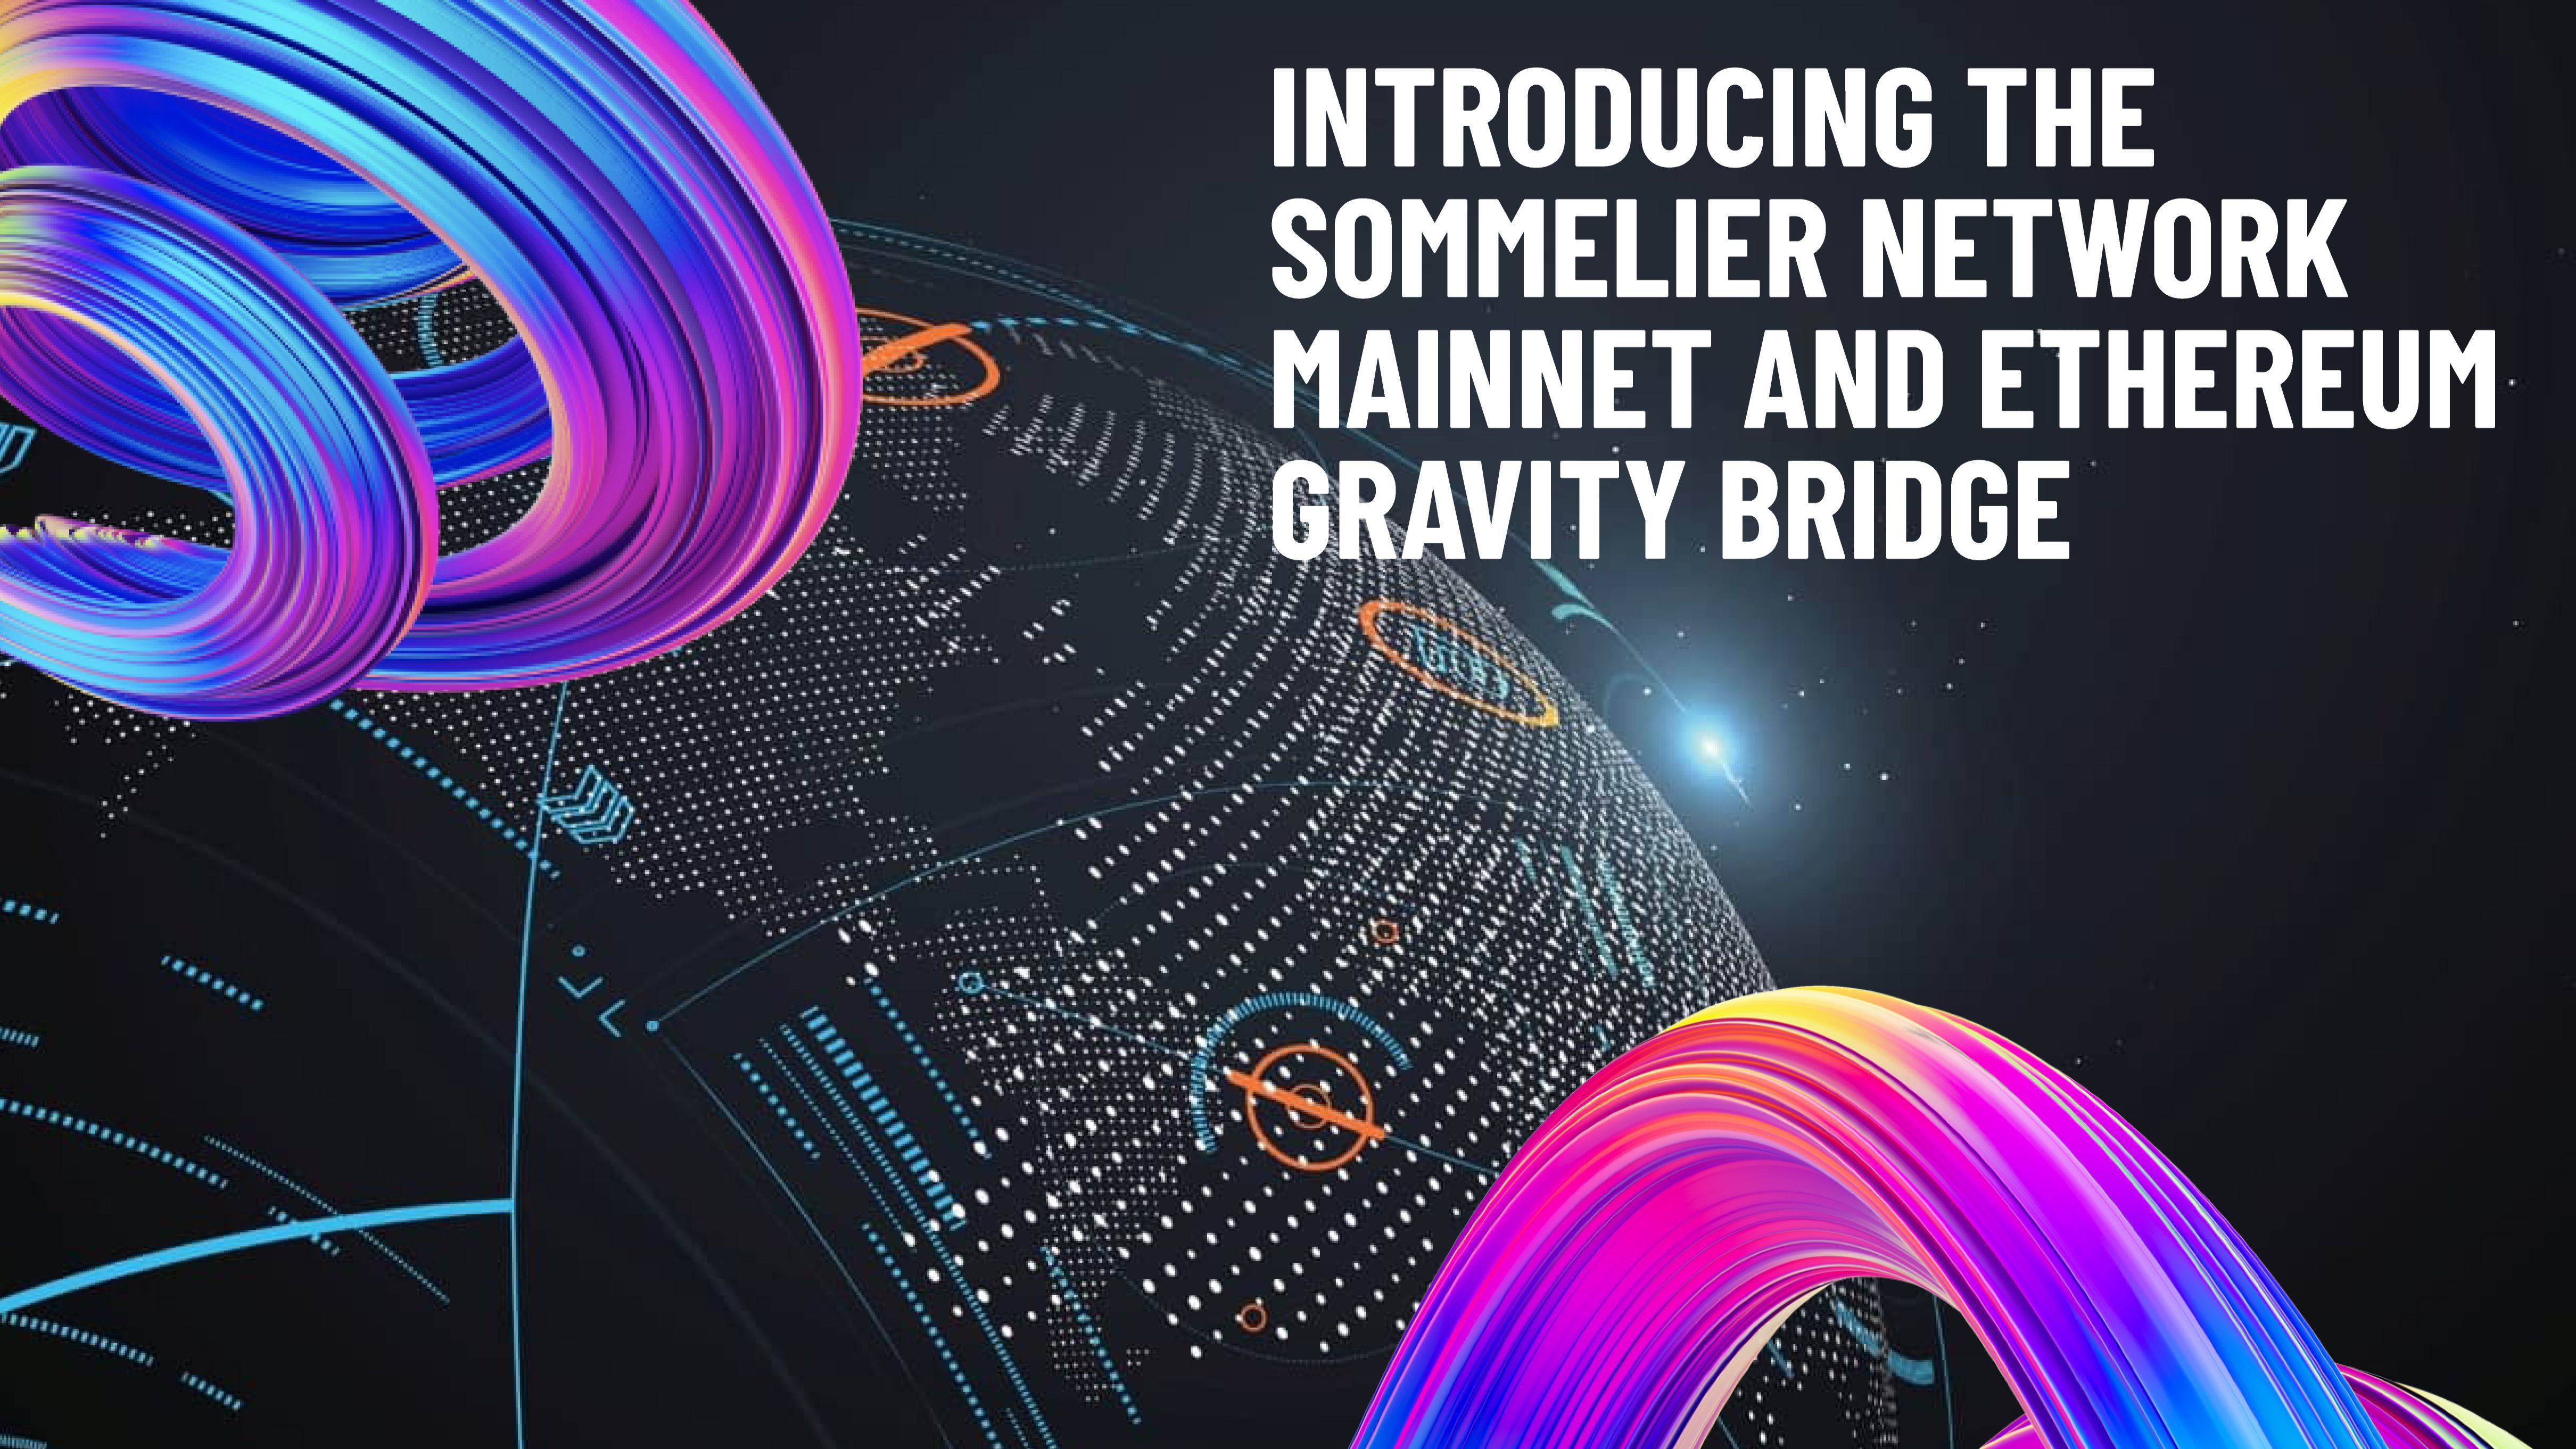
Introducing the Sommelier Network Mainnet and Ethereum Gravity Bridge
The Top Five Features of the Sommelier Protocol
Call for Validators: The Two Step Process for 2021
Two New Features Launched to Test Liquidity Management on Uniswap v3

Uniswap v3 Remove Smart Contract Incident Post Mortem for Sommelier
Call for Validators: Road to Sommelier Mainnet
Sommelier Liquidity AMA With Yenwen and Nick From Perpetual Protocol
Sommelier Liquidity AMA With Tascha Pan From Alpha Finance
Sommelier Liquidity AMA With Loi Luu From Kyber Network
Sommelier Liquidity AMA With Alex From Peanut
Sommelier Liquidity AMA With JP From THORChain
Sommelier Liquidity AMA With Alan Chiu From OMGX Network
Sommelier Liquidity AMA With Ari From Gelato Network
Sommelier Liquidity AMA With Sunny Aggarwal From Osmosis
A Fine Sommelier Explanation of Bollinger Bands With Kevin Kennis
Sommelier Liquidity AMA With Mona El Isa From Enzyme
Sommelier Liquidity AMA With Haxor From Method Finance
Sommelier Liquidity AMA With Tor From Secret Network
Liquidity Provider Insights With Zaki Manian - Ep. 7 - DeFi Automation Space on Uniswap v3 and Where Sommelier’s Heading

Sommelier Liquidity AMA With Geralt From CyberFi

A Pairings Tutorial of Two Sided Liquidity Addition with Sommelier
Liquidity Provider Insights with Zaki Manian - Ep. 6 - Liquidity Providers Need to Gear Up for a Multi-Chain World

Three New Summer Features for Liquidity Providers
Sommelier Liquidity AMA with Tom C and Max W from Charm

Sommelier Liquidity AMA with Dereek69 & Shalaquiana from BIOPset

Sommelier This Week - June 3rd 2021: The Road to Mainnet
Sommelier Liquidity AMA with Federico Landini from DefiLab
Sommelier Liquidity AMA with Michael Egorov from Curve
Liquidity Provider Insights with Zaki Manian - Ep. 5 - A Bright Light at the End of a Long, Tough Weekend for Bitcoin
Sommelier This Week - May 27th 2021: What Aspiring Sommelier Validators Need to Know on Last Week’s Protocol and App Progress
Liquidity Provider Insights with Zaki Manian (Special Edition) - Ep. 4 - New Pairings Release
Sommelier R&D AMA With Yaniv Tal From the Graph
Sommelier Liquidity AMA with MacLane Wilkison from NuCypher
The Eight Steps to Become a Liquidity Provider with Pairings
Sommelier NFT Awards - May 18th, 2021
Pairings By Sommelier: The FAQ
Zaki Manian Breaks Down What Liquidity Providers Need to Know Under Uniswap v3
Sommelier This Week - May 6th 2021: How This Week’s Protocol and App Progress Weaves Together to Make a Product
Sommelier Liquidity AMA with Dan Thomson from InsurAce
Sommelier This Week - April 29th 2021: Weeks Away From a Taste of the Sommelier App Experience and How the Dev Team Stays on Track
Zaki Manian Breaks Down a Phase Change Liquidity Providers Need to Know About Automated Market Makers
Introducing Jehan Tremback: Sommelier Core Developer and Althea Co-Founder that pushes the Limits of the Blockchain Bridge with Gravity
Sommelier This Week - April 22nd 2021: An Inside Look at Progress on Coordinating Sommelier Components That Contribute to the Chain
Sommelier This Week - April 15th 2021: Providing a Best-in-Class Experience for Uniswap Liquidity Providers
Sommelier Announces $1M R&D Grant from The Graph Foundation

Introducing LP Rewards: This Week With Cellframe
Introducing Deborah Simpier: Althea CEO and Sommelier Co-Founder Who Brought the Gravity Bridge to Life in The Cosmos
Sommelier This Week - April 8th 2021: What Uniswap v3 Means For Sommelier Architecture and Validators
Introducing Sommelier LP Rewards Program
Sommelier This Week - April 1st 2021: Gravity Bridge and Private Testnets
Blockchain startup decides to acquire a California winery and host NFT wine parties
Introducing Justin Kilpatrick: The Blockchain Bridge Wizard Who Maintains Gravity
Five Ways UniswapV3 changes the world for Liquidity Providers on the AMM
Introducing Jack Zampolin: On Becoming A Sommelier in The Cosmos

Sommelier: Welcome To The New CoProcessor For Ethereum
© 2025 Somm by Bajanss OÜ –Maakri 36-50, Tallinn, Estonia 10145